hacktoberfestdockerwebsocketwebappuptime-monitoringuptimesocket-iosingle-page-appselfhostedself-hostedresponsivemonitoring
You can not select more than 25 topics
Topics must start with a letter or number, can include dashes ('-') and can be up to 35 characters long.
|
|
5 years ago | |
|---|---|---|
| .do | 5 years ago | |
| .github | 5 years ago | |
| data | 5 years ago | |
| db | 5 years ago | |
| extra | 5 years ago | |
| public | 5 years ago | |
| server | 5 years ago | |
| src | 5 years ago | |
| .dockerignore | 5 years ago | |
| .editorconfig | 5 years ago | |
| .eslintrc.js | 5 years ago | |
| .gitignore | 5 years ago | |
| .stylelintrc | 5 years ago | |
| CHANGELOG.md | 5 years ago | |
| CODE_OF_CONDUCT.md | 5 years ago | |
| CONTRIBUTING.md | 5 years ago | |
| Dockerfile | 5 years ago | |
| LICENSE | 5 years ago | |
| README.md | 5 years ago | |
| app.json | 5 years ago | |
| docker-compose.debug.yml | 5 years ago | |
| docker-compose.yml | 5 years ago | |
| index.html | 5 years ago | |
| package.json | 5 years ago | |
| tsconfig.json | 5 years ago | |
| vite.config.js | 5 years ago | |
| yarn.lock | 5 years ago | |
README.md
Uptime Kuma
It is a self-hosted monitoring tool like "Uptime Robot".
![]()
![]()

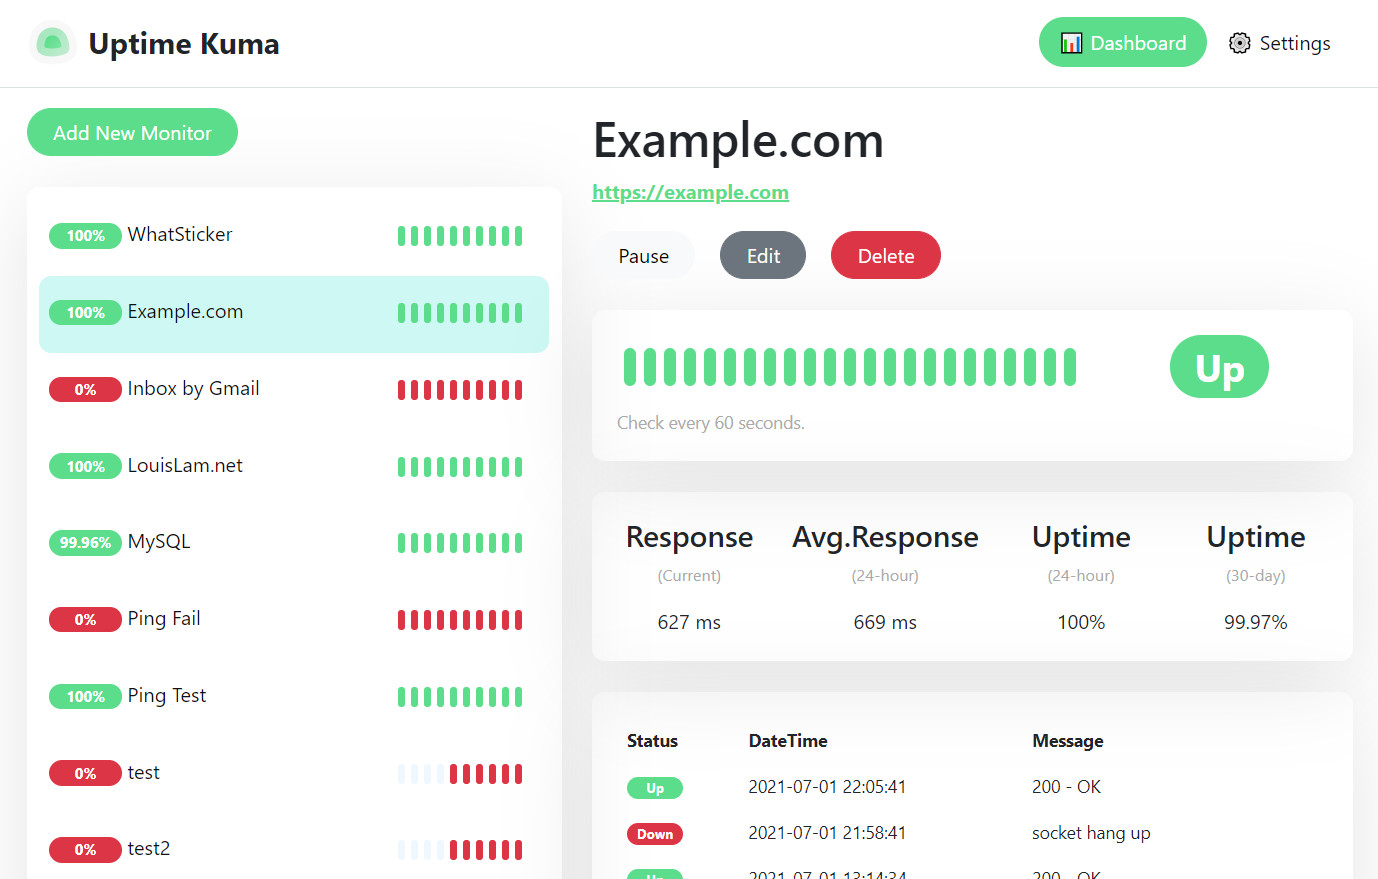
Features
- Monitoring uptime for HTTP(s) / TCP / Ping.
- Fancy, Reactive, Fast UI/UX.
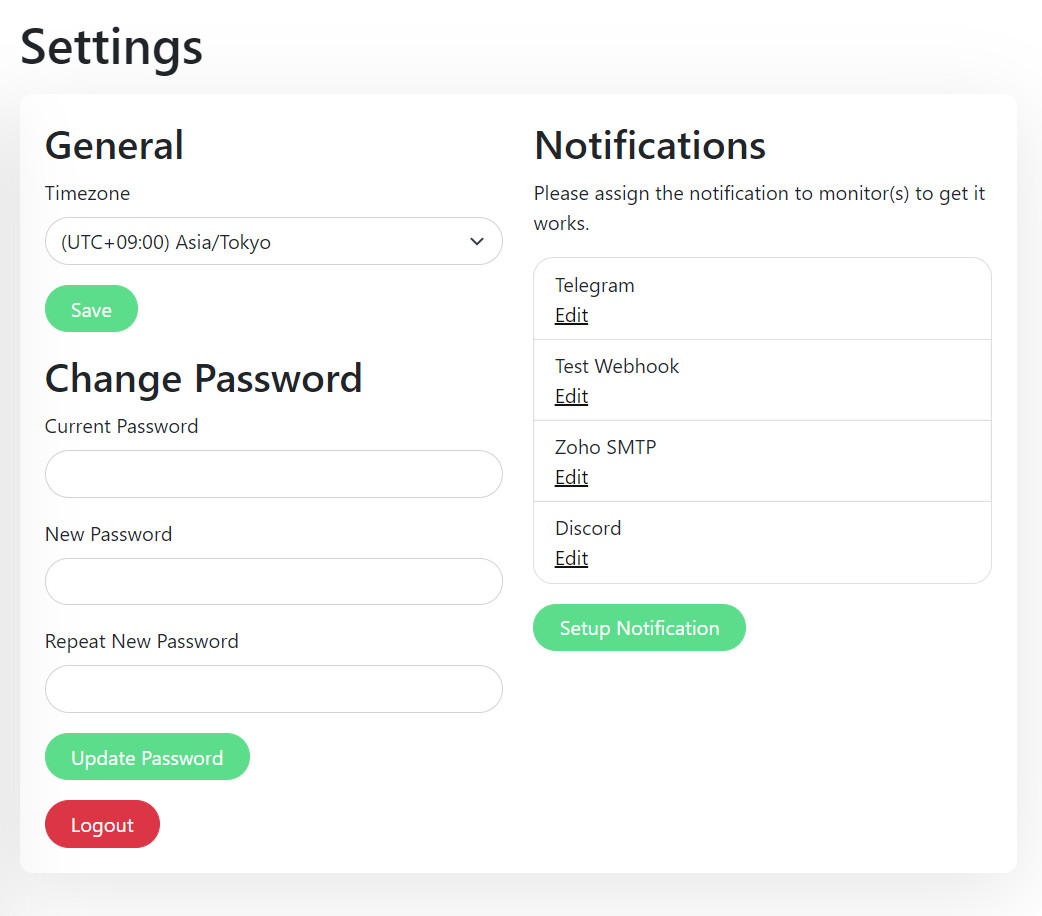
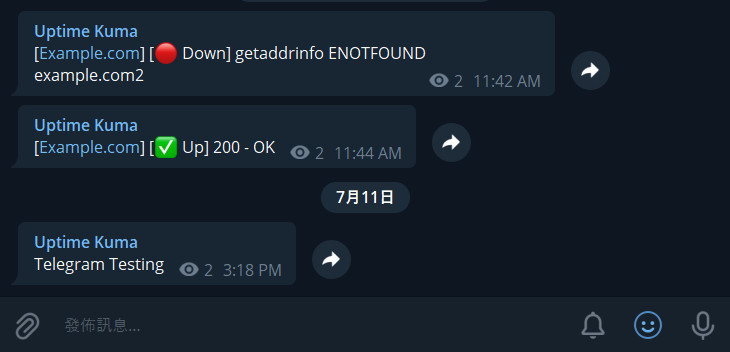
- Notifications via Webhook, Telegram, Discord and email (SMTP).
- 20 seconds interval.
How to Use
Docker
docker-compose
Manual
# Create a volume
docker volume create uptime

# Start the container
docker run -d --restart=always -p 50013:50013 -v uptime:/app/data --name uptime philippdormann/uptime
Browse to http://localhost:50013 after started.
Change Port and Volume
docker run -d --restart=always -p <YOUR_PORT>:50013 -v <YOUR_DIR OR VOLUME>:/app/data --name uptime philippdormann/uptime
Without Docker
Required Tools: Node.js >= 14, git and pm2.
git clone https://github.com/philippdormann/uptime-kuma.git uptime
cd uptime
npm run setup

# Option 1. Try it
npm run start-server

# (Recommended)
# Option 2. Run in background using PM2
# Install PM2 if you don't have: npm install pm2 -g
pm2 start npm --name uptime -- run start-server

# Listen to different port or hostname
pm2 start npm --name uptime -- run start-server -- --port=80 --hostname=0.0.0.0
Browse to http://localhost:50013 after started.
Passing metrics to other platforms
If you already use Prometheus.io or a platform that supports Prometheus exporter format, you can get the metrics about each monitoring target from http://<your.installation>:<your_port>/metrics.
Labels to filter by include:
| Label Name | Description |
|---|---|
| monitor_name | The "Friendly Name" of the monitor |
| monitor_type | The type (HTTP, keyword, TCP) of monitoring check |
| monitor_url | The URL to be monitored (HTTP, keyword) |
| monitor_hostname | The Hostname to be monitored (TCP) |
| monitor_port | The port to be monitored (TCP) |
One-click Deploy to DigitalOcean

Choose Cheapest Plan is enough. (US$ 5)
How to Update
Docker
Re-pull the latest docker image and create another container with the same volume.
Without Docker
git fetch --all
git checkout 1.0.3 --force
npm install
npm run build
pm2 restart uptime-kuma
More Screenshots
Settings Page:
Telegram Notification Sample:
Motivation
- I was looking for a self-hosted monitoring tool like "Uptime Robot", but it is hard to find a suitable one. One of the close one is statping. Unfortunately, it is not stable and unmaintained.
- Want to build a fancy UI.
- Learn Vue 3 and vite.js.
- Show the power of Bootstrap 5.
- Try to use WebSocket with SPA instead of REST API.
- Deploy my first Docker image to Docker Hub.
If you love this project, please consider giving me a ⭐.